Arduino - Traceur Web

Dans ce tutoriel, nous apprendrons à construire un traceur web qui ressemble au Traceur Série dans l'IDE Arduino. Avec ce système, vous pouvez facilement surveiller les données en temps réel provenant d'un Arduino à l'aide d'un navigateur web sur votre smartphone ou ordinateur. Les données seront affichées sous forme de graphique, semblable à ce que vous voyez dans le Traceur Série dans l'IDE Arduino.

Traceur web Arduino

Préparation du matériel

1×Arduino UNO R4 WiFi
1×USB Cable Type-C
1×(Optional) 9V Power Adapter for Arduino
1×(Recommended) Screw Terminal Block Shield for Arduino Uno
1×(Optional) Transparent Acrylic Enclosure For Arduino Uno

Or you can buy the following sensor kits:

1×DIYables Sensor Kit (30 sensors/displays)
1×DIYables Sensor Kit (18 sensors/displays)
Divulgation : Certains des liens fournis dans cette section sont des liens affiliés Amazon. Nous pouvons recevoir une commission pour tout achat effectué via ces liens, sans coût supplémentaire pour vous. Nous vous remercions de votre soutien.

Comment fonctionne le traceur Web

Voici comment fonctionne le processus :

  • Le code Arduino configure à la fois un serveur web et un serveur WebSocket.
  • Lorsqu'un utilisateur accède à la page web hébergée sur la carte Arduino via un navigateur web, le serveur web renvoie le contenu de la page web (HTML, CSS, JavaScript) au navigateur.
  • Le code JavaScript sur la page web crée un graphique qui ressemble au Plotter Série.
  • Lorsqu'un utilisateur clique sur le bouton de connexion sur la page web, le JavaScript initie une connexion WebSocket avec le serveur WebSocket sur la carte Arduino.
  • L'Arduino transmet les données au navigateur web via cette connexion WebSocket dans un format similaire à celui utilisé par le Plotter Série (détails dans la section suivante).
  • Le code JavaScript dans le navigateur web reçoit ces données et les affiche sur le graphique.

Le format de données que l'Arduino envoie au traceur web

Pour tracer plusieurs variables, nous devons séparer les variables les unes des autres par le caractère «\t» ou " ". La dernière valeur DOIT être terminée par les caractères «\r\n».

En détail :

  • La première variable
webSocket.broadcast(WebSocket::DataType::TEXT, variable_1.c_str(), variable_1.length());
  • Les variables intermédiaires
webSocket.broadcast(WebSocket::DataType::TEXT, " ", 1); // un caractère de tabulation '\t' ou d'espace ' ' est imprimé entre les deux valeurs. webSocket.broadcast(WebSocket::DataType::TEXT, variable_2.c_str(), variable_2.length()); webSocket.broadcast(WebSocket::DataType::TEXT, " ", 1); // un caractère de tabulation '\t' ou d'espace ' ' est imprimé entre les deux valeurs. webSocket.broadcast(WebSocket::DataType::TEXT, variable_3.c_str(), variable_3.length());
  • La dernière variable
webSocket.broadcast(WebSocket::DataType::TEXT, " ", 1); // un caractère de tabulation '\t' ou espace ' ' est imprimé entre les deux valeurs. webSocket.broadcast(WebSocket::DataType::TEXT, variable_4.c_str(), variable_4.length()); webSocket.broadcast(WebSocket::DataType::TEXT, "\r\n", 2); // la dernière valeur est terminée par un retour chariot et un saut de ligne.

Pour plus de détails, veuillez consulter le tutoriel Arduino - Traceur Série.

Code Arduino - Traceur Web

Le contenu de la page web (HTML, CSS, JavaScript) est stocké séparément dans un fichier index.h. Nous aurons donc deux fichiers de code dans l'IDE Arduino :

  • Un fichier .ino contenant du code Arduino, qui crée un serveur web et un serveur WebSocket.
  • Un fichier .h, qui contient le contenu de la page web.

Étapes rapides

  • Si c'est la première fois que vous utilisez Arduino Uno R4, consultez comment configurer l'environnement pour Arduino Uno R4 sur Arduino IDE.
  • Connectez la carte Arduino à votre PC via un câble micro USB.
  • Ouvrez Arduino IDE sur votre PC.
  • Sélectionnez la bonne carte Arduino (Arduino Uno R4 WiFi) et le port COM.
  • Ouvrez le Gestionnaire de bibliothèques en cliquant sur l'icône du Gestionnaire de bibliothèques dans la barre de navigation gauche de l'Arduino IDE.
  • Recherchez "mWebSockets", puis trouvez les mWebSockets créés par Dawid Kurek.
  • Cliquez sur le bouton Installer pour installer la bibliothèque mWebSockets.
Bibliothèque mWebSockets Arduino
  • Sur Arduino IDE, créez un nouveau sketch, nommez-le, par exemple, ArduinoGetStarted.com.ino
  • Copiez le code ci-dessous et ouvrez-le avec Arduino IDE
/* * Ce code Arduino a été développé par newbiely.fr * Ce code Arduino est mis à disposition du public sans aucune restriction. * Pour des instructions complètes et des schémas de câblage, veuillez visiter: * https://newbiely.fr/tutorials/arduino/arduino-web-plotter */ #include <WiFiS3.h> #include <WebSocketServer.h> #include "index.h" using namespace net; WebSocketServer webSocket(81); WiFiServer server(80); const char* ssid = "YOUR_WIFI_SSID"; // CHANGE IT const char* password = "YOUR_WIFI_PASSWORD"; // CHANGE IT int last_update = 0; void setup() { Serial.begin(9600); delay(1000); // Connect to Wi-Fi WiFi.begin(ssid, password); while (WiFi.status() != WL_CONNECTED) { delay(1000); Serial.println("Connecting to WiFi..."); } Serial.println("Connected to WiFi"); // Initialize WebSocket server webSocket.begin(); server.begin(); Serial.print("Arduino Web Server's IP address: "); Serial.println(WiFi.localIP()); } void loop() { webSocket.listen(); if (millis() - last_update > 500) { last_update = millis(); String variable_1 = String(random(0, 100)); String variable_2 = String(random(0, 100)); String variable_3 = String(random(0, 100)); String variable_4 = String(random(0, 100)); // TO SERIAL PLOTTER Serial.print(variable_1); Serial.print(" "); // a tab '\t' or space ' ' character is printed between the two values. Serial.print(variable_2); Serial.print(" "); // a tab '\t' or space ' ' character is printed between the two values. Serial.print(variable_3); Serial.print(" "); // a tab '\t' or space ' ' character is printed between the two values. Serial.println(variable_4); // the last value is terminated by a carriage return and a newline characters. // TO WEB PLOTTER webSocket.broadcast(WebSocket::DataType::TEXT, variable_1.c_str(), variable_1.length()); webSocket.broadcast(WebSocket::DataType::TEXT, " ", 1); // a tab '\t' or space ' ' character is printed between the two values. webSocket.broadcast(WebSocket::DataType::TEXT, variable_2.c_str(), variable_2.length()); webSocket.broadcast(WebSocket::DataType::TEXT, " ", 1); // a tab '\t' or space ' ' character is printed between the two values. webSocket.broadcast(WebSocket::DataType::TEXT, variable_3.c_str(), variable_3.length()); webSocket.broadcast(WebSocket::DataType::TEXT, " ", 1); // a tab '\t' or space ' ' character is printed between the two values. webSocket.broadcast(WebSocket::DataType::TEXT, variable_4.c_str(), variable_4.length()); webSocket.broadcast(WebSocket::DataType::TEXT, "\r\n", 2); // the last value is terminated by a carriage return and a newline characters. } // listen for incoming clients WiFiClient client = server.available(); if (client) { // read the HTTP request header line by line while (client.connected()) { if (client.available()) { String HTTP_header = client.readStringUntil('\n'); // read the header line of HTTP request if (HTTP_header.equals("\r")) // the end of HTTP request break; Serial.print("<< "); Serial.println(HTTP_header); // print HTTP request to Serial Monitor } } // send the HTTP response header client.println("HTTP/1.1 200 OK"); client.println("Content-Type: text/html"); client.println("Connection: close"); // the connection will be closed after completion of the response client.println(); // the separator between HTTP header and body String html = String(HTML_CONTENT); client.println(html); client.flush(); // give the web browser time to receive the data delay(50); // close the connection: client.stop(); } }
  • Modifiez les informations WiFi (SSID et mot de passe) dans le code pour qu'elles correspondent à vos propres identifiants de réseau.
  • Créez le fichier index.h sur l'IDE Arduino en :
    • Cliquant soit sur le bouton situé juste en dessous de l'icône du moniteur série et choisissez Nouvel Onglet, soit en utilisant les touches Ctrl+Shift+N.
    Arduino IDE 2 ajoute un fichier
    • Donnez le nom de fichier index.h et cliquez sur le bouton OK.
    Arduino IDE 2 ajoute le fichier index.h.
    • Copiez le code ci-dessous et collez-le dans index.h.
    /* * Ce code Arduino a été développé par newbiely.fr * Ce code Arduino est mis à disposition du public sans aucune restriction. * Pour des instructions complètes et des schémas de câblage, veuillez visiter: * https://newbiely.fr/tutorials/arduino/arduino-web-plotter */ 
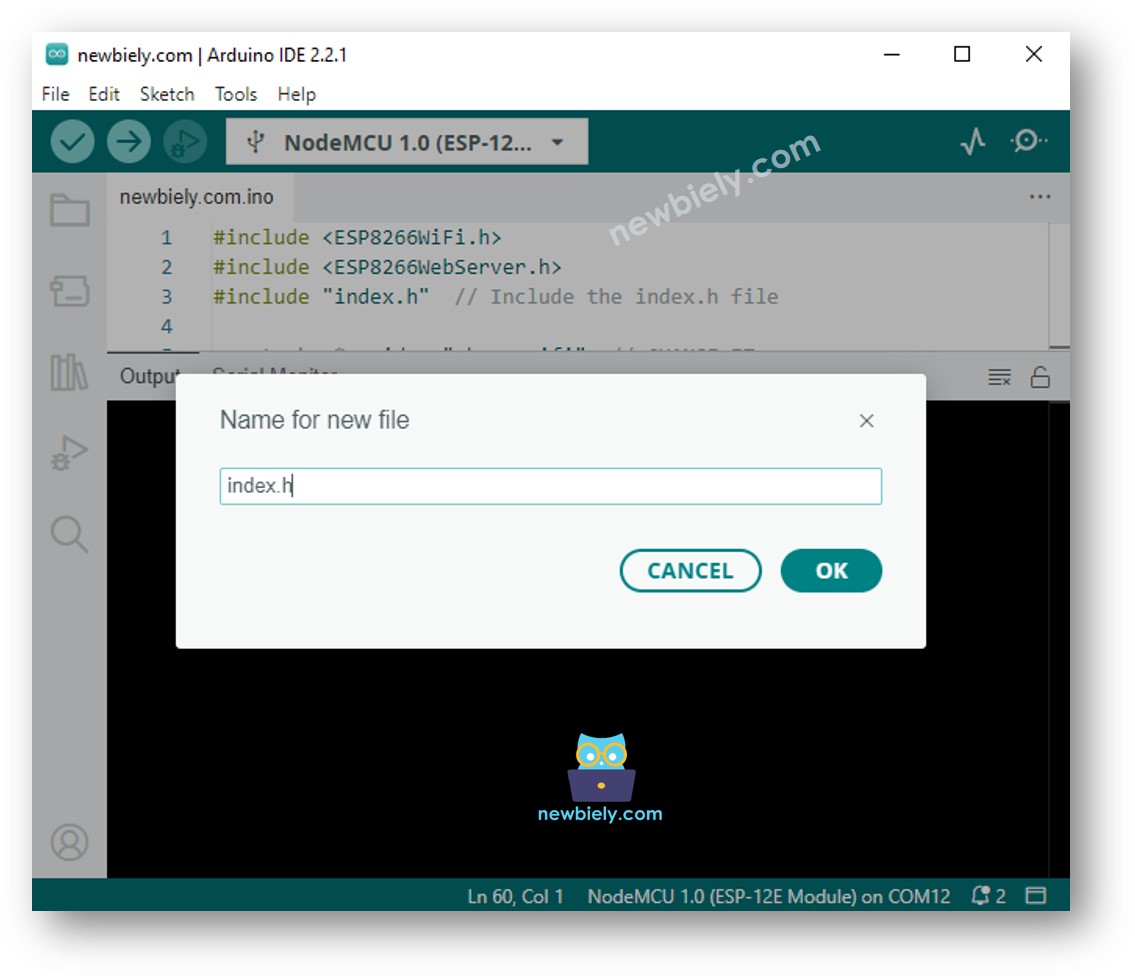
const char *HTML_CONTENT = R"=====( <!DOCTYPE html> <html> <head> <title>Arduino - Web Plotter</title> <meta name="viewport" content="width=device-width, initial-scale=0.7"> <style> body {text-align: center; height: 750px; } h1 {font-weight: bold; font-size: 20pt; padding-bottom: 5px; color: navy; } h2 {font-weight: bold; font-size: 15pt; padding-bottom: 5px; } button {font-weight: bold; font-size: 15pt; } #footer {width: 100%; margin: 0px; padding: 0px 0px 10px 0px; bottom: 0px; } .sub-footer {margin: 0 auto; position: relative; width:400px; } .sub-footer a {position: absolute; font-size: 10pt; top: 3px; } </style> <script> var COLOR_BACKGROUND = "#FFFFFF"; var COLOR_TEXT = "#000000"; var COLOR_BOUND = "#000000"; var COLOR_GRIDLINE = "#F0F0F0"; //var COLOR_LINE = ["#33FFFF", "#FF00FF", "#FF0000", "#FF8C00", "#00FF00"]; //var COLOR_LINE = ["#0000FF", "#FF0000", "#00FF00", "#FF8C00", "#00FF00"]; //var COLOR_LINE = ["#33FFFF", "#FF0000", "#00FF00", "#FF8C00", "#00FF00"]; var COLOR_LINE = ["#0000FF", "#FF0000", "#009900", "#FF9900", "#CC00CC", "#666666", "#00CCFF", "#000000"]; var LEGEND_WIDTH = 10; var X_AXIS_TITLE_HEIGHT = 40; var Y_AXIS_TITLE_WIDTH = 40; var X_AXIS_VALUE_HEIGHT = 40; var Y_AXIS_VALUE_WIDTH = 50; var PLOT_AREA_PADDING_TOP = 30; var PLOT_AREA_PADDING_RIGHT = 30; var X_GRIDLINE_NUM = 5; var Y_GRIDLINE_NUM = 4; var WSP_SIZE_TYPE = 1; /* 0: Fixed size, 1: full screen */ var WSP_WIDTH = 400; var WSP_HEIGHT = 200; var MAX_SAMPLE = 50; // in sample var X_AXIS_MIN = 0; var X_AXIS_MAX = MAX_SAMPLE; var Y_AXIS_AUTO_SCALE = 1; /* 0: y axis fixed range, 1: y axis auto scale */ var Y_AXIS_MIN = -5; var Y_AXIS_MAX = 5; var X_AXIS_TITLE = "X"; var Y_AXIS_TITLE = "Y"; var plot_area_width; var plot_area_height; var plot_area_pivot_x; var plot_area_pivot_y; var sample_count = 0; var buffer = ""; var data = []; var ws; var canvas; var ctx; function init() { canvas = document.getElementById("graph"); canvas.style.backgroundColor = COLOR_BACKGROUND; ctx = canvas.getContext("2d"); canvas_resize(); setInterval(update_view, 1000 / 60); } function connect_onclick() { if(ws == null) { ws = new WebSocket("ws://" + window.location.host + ":81"); document.getElementById("ws_state").innerHTML = "CONNECTING"; ws.onopen = ws_onopen; ws.onclose = ws_onclose; ws.onmessage = ws_onmessage; ws.binaryType = "arraybuffer"; } else ws.close(); } function ws_onopen() { document.getElementById("ws_state").innerHTML = "<span style='color: blue'>CONNECTED</span>"; document.getElementById("bt_connect").innerHTML = "Disconnect"; } function ws_onclose() { document.getElementById("ws_state").innerHTML = "<span style='color: gray'>CLOSED</span>"; document.getElementById("bt_connect").innerHTML = "Connect"; ws.onopen = null; ws.onclose = null; ws.onmessage = null; ws = null; } function ws_onmessage(e_msg) { e_msg = e_msg || window.event; // MessageEvent console.log(e_msg.data); buffer += e_msg.data; buffer = buffer.replace(/\r\n/g, "\n"); buffer = buffer.replace(/\r/g, "\n"); while(buffer.indexOf("\n") == 0) buffer = buffer.substr(1); if(buffer.indexOf("\n") <= 0) return; var pos = buffer.lastIndexOf("\n"); var str = buffer.substr(0, pos); var new_sample_arr = str.split("\n"); buffer = buffer.substr(pos + 1); for(var si = 0; si < new_sample_arr.length; si++) { var str = new_sample_arr[si]; var arr = []; if(str.indexOf("\t") > 0) arr = str.split("\t"); else arr = str.split(" "); for(var i = 0; i < arr.length; i++) { var value = parseFloat(arr[i]); if(isNaN(value)) continue; if(i >= data.length) { var new_line = [value]; data.push(new_line); // new line } else data[i].push(value); } sample_count++; } for(var line = 0; line < data.length; line++) { while(data[line].length > MAX_SAMPLE) data[line].splice(0, 1); } if(Y_AXIS_AUTO_SCALE) auto_scale(); } function map(x, in_min, in_max, out_min, out_max) { return (x - in_min) * (out_max - out_min) / (in_max - in_min) + out_min; } function get_random_color() { var letters = '0123456789ABCDEF'; var _color = '#'; for (var i = 0; i < 6; i++) _color += letters[Math.floor(Math.random() * 16)]; return _color; } function update_view() { if(sample_count <= MAX_SAMPLE) X_AXIS_MAX = sample_count; else X_AXIS_MAX = 50; ctx.clearRect(0, 0, WSP_WIDTH, WSP_HEIGHT); ctx.save(); ctx.translate(plot_area_pivot_x, plot_area_pivot_y); ctx.font = "bold 20px Arial"; ctx.textBaseline = "middle"; ctx.textAlign = "center"; ctx.fillStyle = COLOR_TEXT; // draw X axis title if(X_AXIS_TITLE != "") { ctx.fillText(X_AXIS_TITLE, plot_area_width / 2, X_AXIS_VALUE_HEIGHT + X_AXIS_TITLE_HEIGHT / 2); } // draw Y axis title if(Y_AXIS_TITLE != "") { ctx.rotate(-90 * Math.PI / 180); ctx.fillText(Y_AXIS_TITLE, plot_area_height / 2, -Y_AXIS_VALUE_WIDTH - Y_AXIS_TITLE_WIDTH / 2); ctx.rotate(90 * Math.PI / 180); } ctx.font = "16px Arial"; ctx.textAlign = "right"; ctx.strokeStyle = COLOR_BOUND; for(var i = 0; i <= Y_GRIDLINE_NUM; i++) { var y_gridline_px = -map(i, 0, Y_GRIDLINE_NUM, 0, plot_area_height); y_gridline_px = Math.round(y_gridline_px) + 0.5; ctx.beginPath(); ctx.moveTo(0, y_gridline_px); ctx.lineTo(plot_area_width, y_gridline_px); ctx.stroke(); ctx.strokeStyle = COLOR_BOUND; ctx.beginPath(); ctx.moveTo(-7 , y_gridline_px); ctx.lineTo(4, y_gridline_px); ctx.stroke(); var y_gridline_value = map(i, 0, Y_GRIDLINE_NUM, Y_AXIS_MIN, Y_AXIS_MAX); y_gridline_value = y_gridline_value.toFixed(1); ctx.fillText(y_gridline_value + "", -15, y_gridline_px); ctx.strokeStyle = COLOR_GRIDLINE; } ctx.strokeStyle = COLOR_BOUND; ctx.textAlign = "center"; ctx.beginPath(); ctx.moveTo(0.5, y_gridline_px - 7); ctx.lineTo(0.5, y_gridline_px + 4); ctx.stroke(); for(var i = 0; i <= X_GRIDLINE_NUM; i++) { var x_gridline_px = map(i, 0, X_GRIDLINE_NUM, 0, plot_area_width); x_gridline_px = Math.round(x_gridline_px) + 0.5; ctx.beginPath(); ctx.moveTo(x_gridline_px, 0); ctx.lineTo(x_gridline_px, -plot_area_height); ctx.stroke(); ctx.strokeStyle = COLOR_BOUND; ctx.beginPath(); ctx.moveTo(x_gridline_px, 7); ctx.lineTo(x_gridline_px, -4); ctx.stroke(); var x_gridline_value; if(sample_count <= MAX_SAMPLE) x_gridline_value = map(i, 0, X_GRIDLINE_NUM, X_AXIS_MIN, X_AXIS_MAX); else x_gridline_value = map(i, 0, X_GRIDLINE_NUM, sample_count - MAX_SAMPLE, sample_count);; ctx.fillText(x_gridline_value.toString(), x_gridline_px, X_AXIS_VALUE_HEIGHT / 2 + 5); ctx.strokeStyle = COLOR_GRIDLINE; } //ctx.lineWidth = 2; var line_num = data.length; for(var line = 0; line < line_num; line++) { // draw graph var sample_num = data[line].length; if(sample_num >= 2) { var y_value = data[line][0]; var x_px = 0; var y_px = -map(y_value, Y_AXIS_MIN, Y_AXIS_MAX, 0, plot_area_height); if(line == COLOR_LINE.length) COLOR_LINE.push(get_random_color()); ctx.strokeStyle = COLOR_LINE[line]; ctx.beginPath(); ctx.moveTo(x_px, y_px); for(var i = 0; i < sample_num; i++) { y_value = data[line][i]; x_px = map(i, X_AXIS_MIN, X_AXIS_MAX -1, 0, plot_area_width); y_px = -map(y_value, Y_AXIS_MIN, Y_AXIS_MAX, 0, plot_area_height); ctx.lineTo(x_px, y_px); } ctx.stroke(); } // draw legend var x = plot_area_width - (line_num - line) * LEGEND_WIDTH - (line_num - line - 1) * LEGEND_WIDTH / 2; var y = -plot_area_height - PLOT_AREA_PADDING_TOP / 2 - LEGEND_WIDTH / 2; ctx.fillStyle = COLOR_LINE[line]; ctx.beginPath(); ctx.rect(x, y, LEGEND_WIDTH, LEGEND_WIDTH); ctx.fill(); } ctx.restore(); } function canvas_resize() { canvas.width = 0; // to avoid wrong screen size canvas.height = 0; if(WSP_SIZE_TYPE) { // full screen document.getElementById('footer').style.position = "fixed"; var width = window.innerWidth - 20; var height = window.innerHeight - 20; WSP_WIDTH = width; WSP_HEIGHT = height - document.getElementById('header').offsetHeight - document.getElementById('footer').offsetHeight; } canvas.width = WSP_WIDTH; canvas.height = WSP_HEIGHT; ctx.font = "16px Arial"; var y_min_text_size = ctx.measureText(Y_AXIS_MIN.toFixed(1) + "").width; var y_max_text_size = ctx.measureText(Y_AXIS_MAX.toFixed(1) + "").width; Y_AXIS_VALUE_WIDTH = Math.round(Math.max(y_min_text_size, y_max_text_size)) + 15; plot_area_width = WSP_WIDTH - Y_AXIS_VALUE_WIDTH - PLOT_AREA_PADDING_RIGHT; plot_area_height = WSP_HEIGHT - X_AXIS_VALUE_HEIGHT - PLOT_AREA_PADDING_TOP; plot_area_pivot_x = Y_AXIS_VALUE_WIDTH; plot_area_pivot_y = WSP_HEIGHT - X_AXIS_VALUE_HEIGHT; if(X_AXIS_TITLE != "") { plot_area_height -= X_AXIS_TITLE_HEIGHT; plot_area_pivot_y -= X_AXIS_TITLE_HEIGHT; } if(Y_AXIS_TITLE != "") { plot_area_width -= Y_AXIS_TITLE_WIDTH; plot_area_pivot_x += Y_AXIS_TITLE_WIDTH; } ctx.lineWidth = 1; } function auto_scale() { if(data.length >= 1) { var max_arr = []; var min_arr = []; for(var i = 0; i < data.length; i++) { if(data[i].length >= 1) { var max = Math.max.apply(null, data[i]); var min = Math.min.apply(null, data[i]); max_arr.push(max); min_arr.push(min); } } var max = Math.max.apply(null, max_arr); var min = Math.min.apply(null, min_arr); var MIN_DELTA = 10.0; if((max - min) < MIN_DELTA) { var mid = (max + min) / 2; max = mid + MIN_DELTA / 2; min = mid - MIN_DELTA / 2; } var range = max - min; var exp; if (range == 0.0) exp = 0; else exp = Math.floor(Math.log10(range / 4)); var scale = Math.pow(10, exp); var raw_step = (range / 4) / scale; var step; potential_steps =[1.0, 1.5, 2.0, 2.5, 3.0, 4.0, 5.0, 6.0, 8.0, 10.0]; for (var i = 0; i < potential_steps.length; i++) { if (potential_steps[i] < raw_step) continue; step = potential_steps[i] * scale; Y_AXIS_MIN = step * Math.floor(min / step); Y_AXIS_MAX = Y_AXIS_MIN + step * (4); if (Y_AXIS_MAX >= max) break; } var count = 5 - Math.floor((Y_AXIS_MAX - max) / step); Y_AXIS_MAX = Y_AXIS_MIN + step * (count - 1); ctx.font = "16px Arial"; var y_min_text_size = ctx.measureText(Y_AXIS_MIN.toFixed(1) + "").width; var y_max_text_size = ctx.measureText(Y_AXIS_MAX.toFixed(1) + "").width; Y_AXIS_VALUE_WIDTH = Math.round(Math.max(y_min_text_size, y_max_text_size)) + 15; plot_area_width = WSP_WIDTH - Y_AXIS_VALUE_WIDTH - PLOT_AREA_PADDING_RIGHT; plot_area_pivot_x = Y_AXIS_VALUE_WIDTH; } } window.onload = init; </script> </head> <body onresize="canvas_resize()"> 
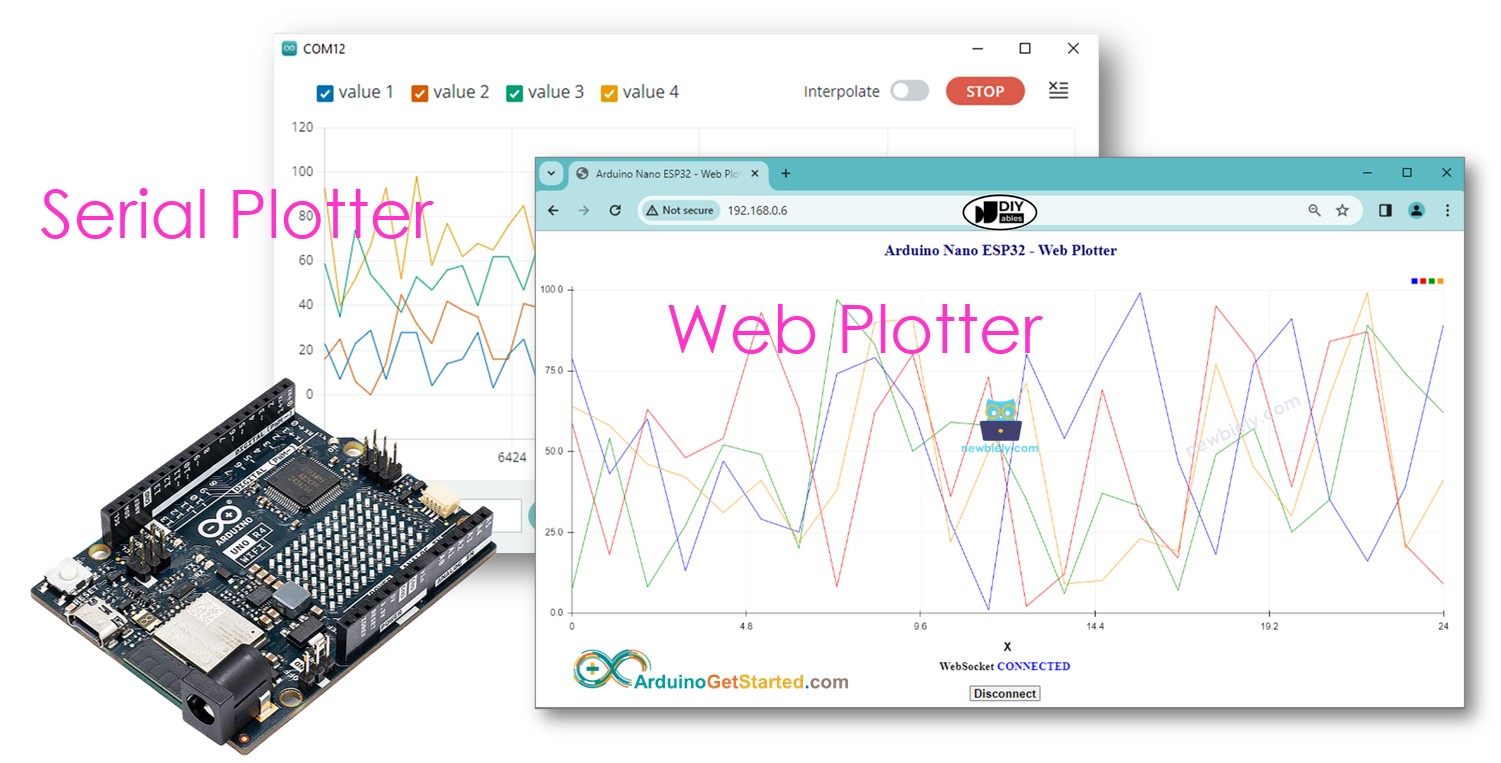
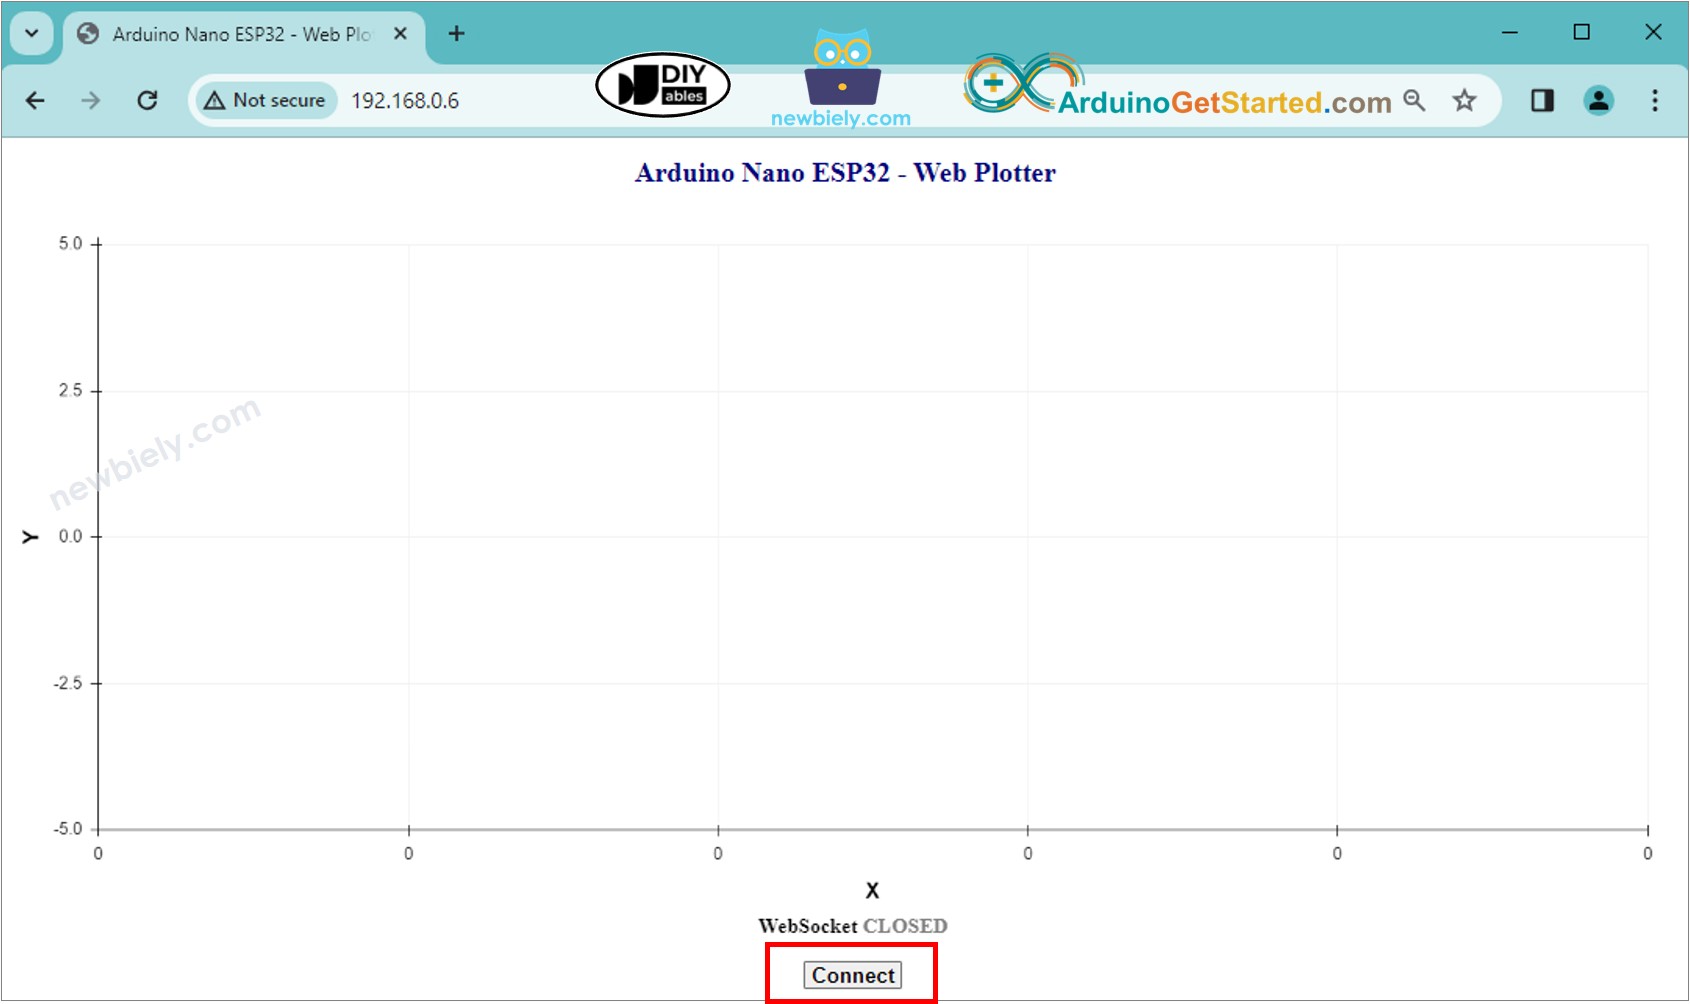
<h1 id="header">Arduino - Web Plotter</h1> <canvas id="graph"></canvas> <br> <div id="footer"> <div class="sub-footer"> 
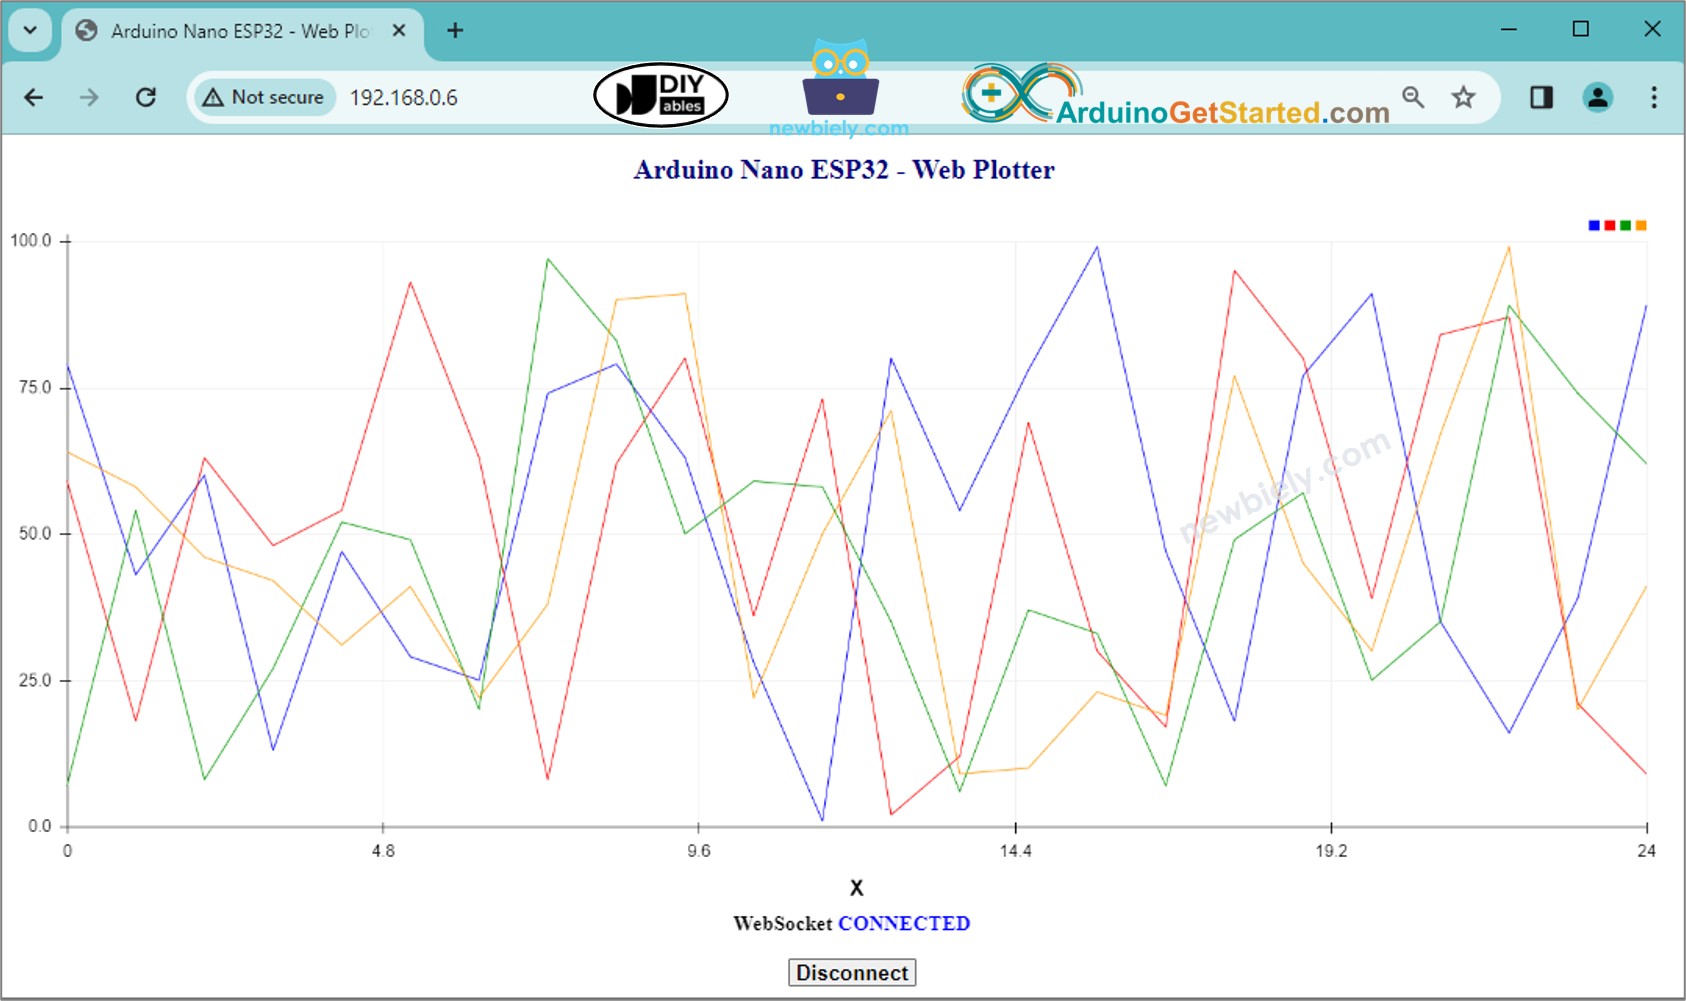
<h2>WebSocket <span id="ws_state"><span style="color: gray">CLOSED</span></span></h2> </div> <button id="bt_connect" type="button" onclick="connect_onclick();">Connect</button> </div> </body> </html> )=====";
    • Maintenant, vous avez le code dans deux fichiers : ArduinoGetStarted.com.ino et index.h
    • Cliquez sur le bouton Upload dans l'IDE Arduino pour téléverser le code sur Arduino.

    Vous verrez une erreur comme ci-dessous :

    In file included from c:\Users\YOU_ACCOUNT\Documents\Arduino\libraries\mWebSockets\src/utility.h:3:0, from c:\Users\YOU_ACCOUNT\Documents\Arduino\libraries\mWebSockets\src/WebSocket.h:5, from c:\Users\YOU_ACCOUNT\Documents\Arduino\libraries\mWebSockets\src/WebSocketServer.h:5, from C:\Users\YOU_ACCOUNT\Documents\Arduino\ArduinoGetStarted.com\ArduinoGetStarted.com.ino:2: C:\Users\YOU_ACCOUNT\Documents\Arduino\libraries\mWebSockets\src/platform.h:54:12: fatal error: Ethernet.h: No such file or directory # include <Ethernet.h> ^~~~~~~~~~~~ compilation terminated. exit status 1

    Pour corriger cette erreur :

    • Accédez au répertoire C:\Users\VOTRE_COMPTE\Documents\Arduino\libraries\mWebSockets\src\.
    • Trouvez le fichier config.h et ouvrez-le avec un éditeur de texte.
    • Regardez la ligne 26, vous la verrez comme ci-dessous :
    #define NETWORK_CONTROLLER ETHERNET_CONTROLLER_W5X00
    • Modifiez cette ligne par celle ci-dessous et enregistrez-la :
    #define NETWORK_CONTROLLER NETWORK_CONTROLLER_WIFI
    • Cliquez sur le bouton Upload dans l'IDE Arduino pour téléverser le code vers Arduino.
    • Ouvrez le moniteur série
    • Vérifiez le résultat sur le moniteur série.
    COM6
    Send
    Connecting to WiFi... Connected to WiFi Arduino Web Server's IP address IP address: 192.168.0.2
    Autoscroll Show timestamp
    Clear output
    9600 baud  
    Newline  
    • Prenez note de l'adresse IP affichée, et entrez cette adresse dans la barre d'adresse d'un navigateur web sur votre smartphone ou PC.
    • Vous verrez la page web comme ci-dessous :
    Navigateur web de traçage Arduino
    • Cliquez sur le bouton CONNECT pour connecter la page web à Arduino via WebSocket.
    • Vous verrez que le traceur trace les données comme sur l'image ci-dessous.
    Graphique web Arduino
    • Vous pouvez ouvrir le Traceur Série dans l'IDE Arduino pour le comparer avec le Traceur Web dans le navigateur web.

    ※ NOTE THAT:

    • Si vous modifiez le contenu HTML dans le fichier index.h sans toucher à quoi que ce soit dans le fichier ArduinoGetStarted.com.ino, lorsque vous compilerez et téléchargerez le code sur Arduino, l'IDE Arduino ne mettra pas à jour le contenu HTML.
    • Pour que l'IDE Arduino mette à jour le contenu HTML dans ce cas, effectuez un changement dans le fichier ArduinoGetStarted.com.ino (par exemple, ajouter une ligne vide, ajouter un commentaire....)

    Explication du code ligne par ligne

    Le code Arduino ci-dessus contient des explications ligne par ligne. Veuillez lire les commentaires dans le code !

※ OUR MESSAGES

  • Please feel free to share the link of this tutorial. However, Please do not use our content on any other websites. We invested a lot of effort and time to create the content, please respect our work!